Association of Optic Disc Hyperfluorescence with Subclinical Macular and Optic Disc Edema in Uveitis Patients
Article information
Abstract
Purpose
To investigate the frequency of optic disc hyperfluorescence (ODH) and their association with macular and optic nerve head thickness in patients with active uveitis.
Methods
This retrospective cross-sectional study included 37 eyes of 30 patients with active noninfectious uveitis who underwent spectral domain-optical coherence tomography (OCT) and fluorescein angiography. OCT parameters were compared between baseline and post-treatment according to the ODH.
Results
ODH was observed clearly in 22 eyes (64.7%) and equivocally in five eyes (14.7%) at baseline. In subgroup analysis without clinically significant optic disc edema, central subfield thickness, peripapillary retinal nerve fiber layer thickness, disc rim area, and disc area were 262.2 μm, 110.9 μm, 1.49 mm2, and 2.02 mm2 at baseline and significantly decreased after treatment (249.5 μm, 102.1 μm, 1.34 mm2, and 1.95 mm2, respectively) in eyes with ODH (p = 0.044, p < 0.001, p = 0.001, p = 0.024, respectively). However, there was no significant changes in the eyes without ODH (all p > 0.05).
Conclusions
There was a difference in the thickness reduction of the macula and optic nerve head according to the ODH. Baseline ODH should be regarded as a sign of ocular inflammation and carefully monitored.
INTRODUCTION
Uveitis refers to a group of inflammatory diseases of the eye which is a major cause of blindness worldwide [1]. The inflammatory process promotes changes in the blood supply, cellular composition and chemical environment of the uveal and retinal tissues. These structural and functional alterations can result in temporary and/or permanent changes in ocular tissue that can be detected by fluorescein angiography (FA) or optical coherence tomography (OCT) and serve as imaging diagnostic biomarkers of ocular inflammation [2,3].
Optic disc and macular edema are posterior segment manifestations of uveitis, with reported rates ranging from 20% to 70%, depending on the ancillary tests used [4]. Pronounced optic disc and macular edema is associated with visual dysfunction and is often detectable by biomicroscope [5,6]. However, previous studies have reported that subtle changes in macular and optic nerve head (ONH) can be detected using retinal imaging modalities even when significant edema is not observed [7,8]. In particular, optic disc hyperfluorescence (ODH) on FA is frequently noted even when the optic disc looks normal, and it has been reported that the disc leakage has a significant influence on the morphology of optic disc [8].
Spectral domain-OCT is an imaging technique that provides in vivo images of the ocular tissues with a resolution beyond that of any other non-invasive technology. Since the introduction of OCT into clinical practice, it has dramatically changed the understanding and the management of many ocular conditions, including those resulting from uveitis. Although preceding studies have reported significant changes in retinal nerve fiber layer (RNFL) thickness and ONH parameters in uveitis [2,9,10], the relationship between the uveitic activity and subclinical findings on retinal imaging remains unclear.
In this study, the frequency of ODH on FA and their association with macula and ONH thickness were investigated in patients with active noninfectious uveitis and changes after treatment.
MATERIALS AND METHODS
Participants
Patients with treatment-naïve active non-infectious uveitis who were referred to Uveitis Clinic of Seoul National University Hospital during the period from June 2017 to March 2020 were enrolled in this retrospective, comparative study. When both eyes met the inclusion criteria, data were recorded for both. This study was approved by the Institutional Review Board of Seoul National University Hospital (IRB No. 2112-086-1285) and adhered to the Declaration of Helsinki. Informed consent was obtained from each patient. The exclusion criteria were as follows; infectious uveitis or posterior uveitis with retinochoroidal infiltrating lesion in the posterior pole; preexisting maculopathy including epiretinal membrane, macular degeneration or pathologic myopia; present or history of glaucoma or optic neuropathy; ONH drusen. Patients with a history of vitreoretinal surgery or retinal photocoagulation, and poor quality images on OCT (signal strength index lower than 5) were also excluded.
Study measurements
At baseline, a detailed demographic and medical history was collected, and all subjects underwent a thorough ophthalmic evaluation, including examination for Snellen visual acuity, anterior segment examination, dilated fundus examination, spectral domain OCT (Cirrus 5000, Carl Zeiss Meditec, Inc., Dublin, CA, USA), and FA (Heidelberg Engineering, Heidelberg, Germany). The causes of uveitis were investigated through a meticulous systemic review and laboratory tests. Patients were referred to internists if systemic diseases were suspected. Uveitic activities were identified and recorded according to the SUN working group guidelines by one uvea specialist (H.G.Y.) [11]. Uveitic activity was defined as “active” in the case of 1+ or more cells in the anterior chamber or anterior vitreous, or active involvement of the posterior segment, and as “minimally active” when there were only 0.5+ cells in the anterior chamber or anterior vitreous without any involvement of the posterior segment. OCT scans were reacquired after treatment when uveitic activity decreased equal to or less than “minimally active.”
Fluorescein angiograms were assessed for the presence of ODH according to the FA grading scheme proposed by the Angiography Scoring for Uveitis Working Group [12]. The integrated software (version 5.1; Carl Zeiss Meditec, Inc.) was used for OCT image analysis obtained from ‘macular and optic disc cube 200 × 200 scans’ and following parameters were measured: central subfield thickness (CSFT), peripapillary RNFL thickness, optic disc rim area and disc area. Mean thicknesses from automated analysis algorithm were used for analysis. Subclinical edema (macular and optic disc) was defined as a thickening of less than the 99th percentile compared to the normal control, and more than the 99th percentile was defined as clinically significant edema, as assessed by the standard distribution scale of the integrated software. Comparisons between baseline and post-treatment were performed for the subgroup with subclinical macular or optic disc edema subjects.
Data analysis
Snellen visual acuity were converted into logarithm of the minimum angle of resolution (logMAR) values. The main outcome variable was the frequency of ODH and OCT parameters including CSFT, peripapillary RNFL thickness, optic disc rim area and disc area. Secondary outcomes included visual acuity, causative diagnosis, anatomic classification of uveitis, time to uveitic activity equal to or less than “minimal,” and frequency of clinically significant macular and optic disc edema at baseline. Comparisons at baseline and after treatment were performed using the Wilcoxon signed-rank test or paired t-test following the Shapiro-Wilk normality test. Correlations between the visual acuity and OCT parameters were determined with Spearman’s rank correlation coefficient. The statistical analysis was performed using SPSS software version 22.0 (IBM Corp, Chicago, IL, USA). A p-value < 0.05 was considered statistically significant.
RESULTS
Thirty-seven eyes of 30 patients (16 men and 14 women) with a mean age of 44.7 ± 17.0 years (range, 17-74 years) were enrolled in the study. The causative diagnosis and anatomic classifications of uveitis are shown in Table 1 according to the optic disc fluorescence on FA. Overall, idiopathic uveitis (26 eyes, 70.3%) and anterior uveitis (18 eyes, 48.6%) were the most frequent among all participants. Clinically significant macular edema was observed in five eyes (13.5%) of four patients, and clinically significant optic disc edema was observed in three eyes (8.1%) of two patients at baseline. In eyes without clinically significant optic disc edema, ODH was clearly observed at baseline in 22 eyes (64.7%), while equivocal ODH was observed in five eyes (14.7%). Uveitic activity was controlled to equal to or less than “minimal” levels within 7.0 ± 3.9 weeks (range, 1-24 weeks).
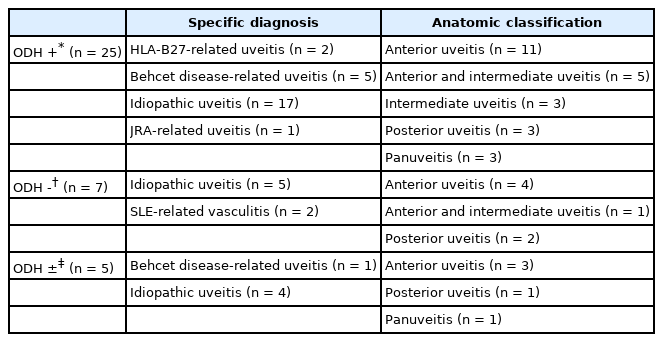
Specific diagnosis and anatomic classification of uveitis according to optic disc fluorescence (ODH) on fluorescein angiography (FA)
In eyes without clinically significant macular edema, CSFT was 253.3 ± 32.5 μm at baseline and 249.5 ± 30.1 μm after treatment (p = 0.170). In the subgroup analysis according to optic disc FA leakage, CSFT decreased from 262.2 ± 33.8 μm to 254.7 ± 34.7 μm (p = 0.044) in eyes with clear ODH, whereas CSFT of the other groups did not show any statistically significant difference (Table 2). In eyes without clinically significant optic disc edema, peripapillary RNFL thickness, disc rim area, and disc area were 110.9 ± 26.7 μm, 1.49 ± 0.38 mm2, and 2.02 ± 0.40 mm2 at baseline, and decreased to 102.1 ± 19.6 μm, 1.34 ± 0.29 mm2, and 1.95 ± 0.35 mm2, respectively (p = 0.001, p < 0.001, p = 0.067). In the subgroup analysis, statistically significant decreases were also observed for peripapillary RNFL thickness, disc rim area, and disc area in eyes with ODH, however, there was no statistically significant difference in subgroup without ODH (all p > 0.05) (Table 2, Fig. 1, 2).

Measurements of central subfield thickness, peripapillary nerve fiber layer thickness, optic disc rim area, and optic disc area according to optic disc fluorescence (ODH) on fluorescein angiography between baseline and after treatment
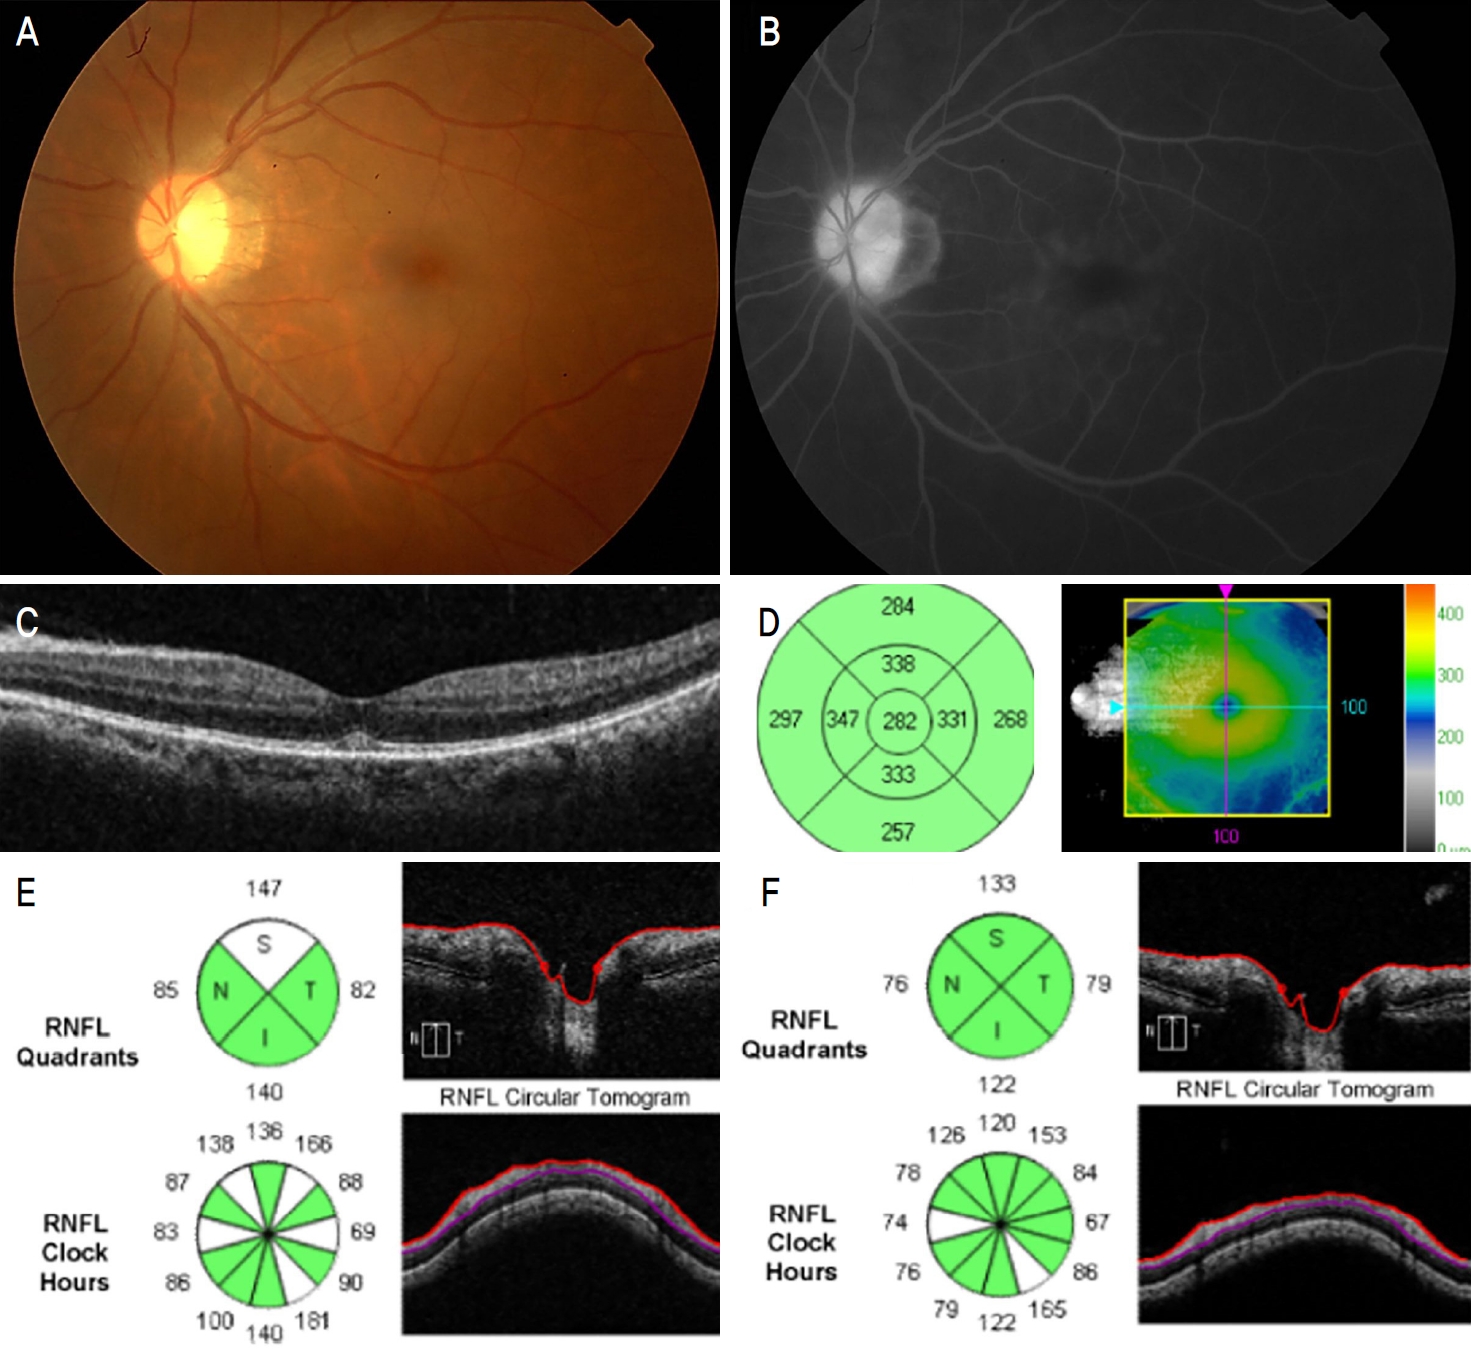
Images from a 54-year-old male with human leukocyte antigen B-27 related panuveitis. (A) There are no significant signs of papilledema or macular edema on fundus photograph. (B) Fluorescein leakage is visible in the macular area, and the optic disc hyperfluorescence is also observed. (C, D) On optical coherence tomography, there is a subtle change in subfovea, but no macular edema is observed. (E) Subclinical peripapillary retinal nerve fiber layer (RNFL) thickening and enlargement of optic disc rim area and total optic disc area was observed at baseline and improved 1 month after subtenon triamcinolone acetate injection and oral corticosteroid treatment (F).

Images from a 62-year-old female with Behcet’s disease related panuveitis. (A) The morphology of optic disc and macular appears normal. (B) Diffuse fluorescein leakage was observed in the perivascular area, but optic disc hyperfluorescence was not observed. (C, D) There were no significant changes in optic nerve head parameters between baseline examination (C) and 1 month after treatment with resolved uveitic activity (D). RNFL = retinal nerve fiber layer; S = superior; T = temporal; N = nasal; I = inferior; C/D = cup-to-disc ratio.
The ratios of RNFL thickness and rim area showed significant correlations with the ratio of CSFT (r = 0.355, p = 0.031; r = 0.353, p = 0.032, respectively), while the ratios of disc area and CSFT were not significantly correlated (p = 0.133). BCVA improved from 0.52 ± 0.44 logMAR to 0.38 ± 0.43 logMAR after treatment (p = 0.012). However, there was no statistically significant correlation between OCT parameters and visual acuity, or between ratios as measured at baseline vs. after treatment (all p > 0.05).
DISCUSSION
This study demonstrated the significance of the ODH in active endogenous uveitis and its association with OCT findings in macula and ONH. Our results showed that eyes with ODH were associated with subclinical macular thickening and optic disc edema. There was also a significant correlation between the macular thickness and ONH parameters. These changes did not affect visual acuity, however, thickened macular and optic disc improved after treatment.
Previous studies have shown that macular thickness is significantly greater than normal in active anterior uveitis [13,14]. Balaskas et al [15] reported a significant thickening of the macular in patients with active anterior uveitis, followed by a progressive decrease after treatment. In addition, peripapillary RNFL thickness was also known to be affected by many types of uveitis [7,8,16,17]. Lee et al [18] reported a significant thickening on the RNFL as well as the macular in patient with active anterior uveitis and suggested that peripapillary RNFL thickness may be useful in assessing disease activity. Our study results coincide with previous studies to some degree, although they did not consider the relationship between OCT and angiographic findings.
Inflammatory mediators have been reported to be associated with macular edema in uveitis [17-21]. Herein, we demonstrated a moderate positive linear relationship between macular thickening and optic disc swelling, particularly in eyes with ODH on FA. It can be assumed from these findings that the same inflammatory mechanism affects both the macula and optic disc. ODH was noted clearly in 22 eyes (64.7%) and equivocally in five eyes (14.7%) in this study. This incidence was is similar to previous reports, in which ODH was observed in 3.6-89.8% of patients with ocular Behcet’s disease and in 66.7% of those with inactive intermediate uveitis [22-25]. A high incidence of ODH on FA in uveitis may imply the persistence of subclinical inflammation, i.e., persistent optic disc swelling, even after the resolution of intermediate uveitis [23]. Besides, previous study has reported that long-standing optic disc edema may lead to a permanent damage, such as RNFL loss [26]. Therefore, ODH should be regarded as a sign of ocular inflammation and carefully monitored.
To date, RNFL and peripapillary retinal thickness have been commonly used as OCT parameters to detect optic disc edema [16,17,27-29]. One of the unique aspect of current study is that additional variables such as optic disc rim area and the optic disc area were also analyzed to evaluate the changes in ONH. The optic disc rim area showed a positive correlation with the peripapillary RNFL thickness, and there were significant changes in the optic disc rim area and the optic disc area after treatment. This suggests that other ONH parameters besides peripapillary RNFL and macula are also affected when there is a subclinical inflammation. Although it is challenging to assess the subtle changes on optic disc based on the normative database of OCT software, changes from baseline OCT examination can be easily identified during the follow-up. In this regard, serial OCT examination may be helpful to identify the progression of subclinical inflammation, especially when ODH is observed on FA.
Meanwhile, an increase in average RNFL thickness due to subclinical optic disc swelling associated with uveitis may affect OCT interpretation in patients with glaucoma. Mwanza et al [30] reported that thinning of at least 4 μm between visits may imply glaucoma progression. In our study, the average RNFL thickness in active uveitis was about 10-μm thicker than that in treated uveitis. Thus, ophthalmologists should pay attention to OCT interpretation to anticipate glaucoma progression in patients with uveitis.
The limitation of this study includes a retrospective design and a relatively small number of study participants. Another limitation is that the degree of inflammation was not objectively measured using laser flare photometry. Despite these limitations, this study investigated the various subtypes of uveitis and addressed the relationship between angiographic features and OCT parameters of the macular and ONH.
In conclusion, eyes with ODH demonstrated subclinical macular thickening and optic disc edema, which improved after treatment. FA may be helpful in assessing the subclinical disease activity in uveitis patients.
Notes
The authors have no conflicts to disclose.